Table of Contents (TOC)
The Table of Contents, briefly TOC from now on, is a place where all layers on the map are kept. It shows what the features in each layer represent and it allows you to manage the order and the visibility of the added layers. Moreover, it contains several tools in order to make edits and analysis on the layers.
Adding Layers
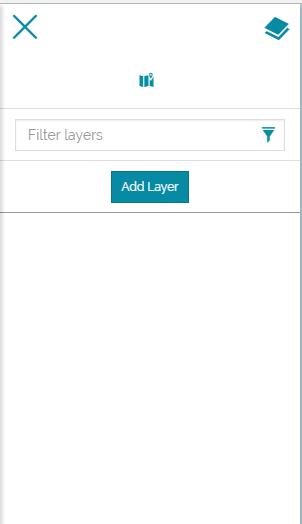
- Click on the Show Layers icon
 on the top-left corner of the map viewer. The TOC will open.
-
Click on the Add Layer icon
 . The Catalog page will open on the right. You will learn more about the Catalog Services in the Menu Bar section.
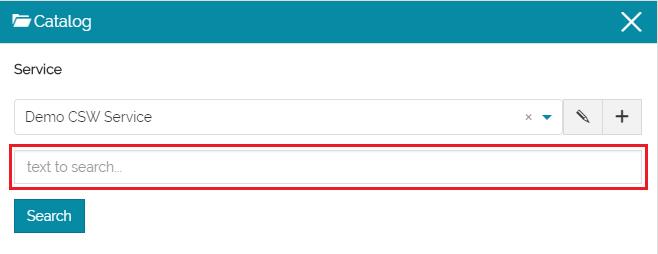
-
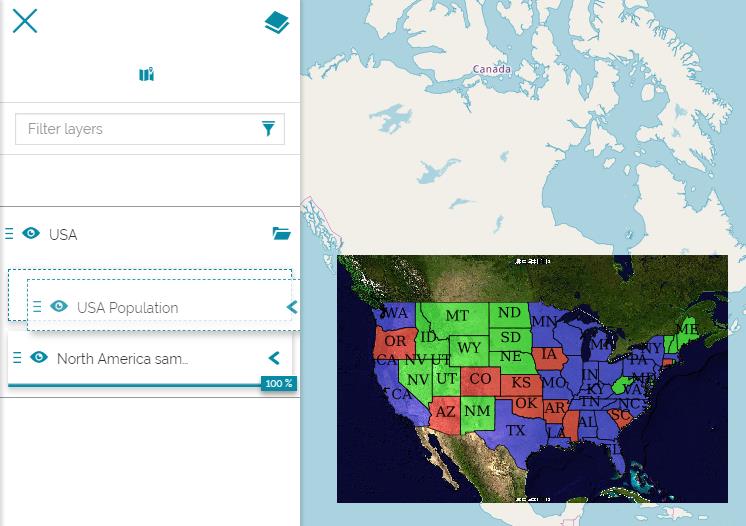
From the search bar highlighted in the figure above. Search for USA POPULATION layer then Click on
 . The layer will be added to the TOC under the Default Layer Group and displayed on the map.
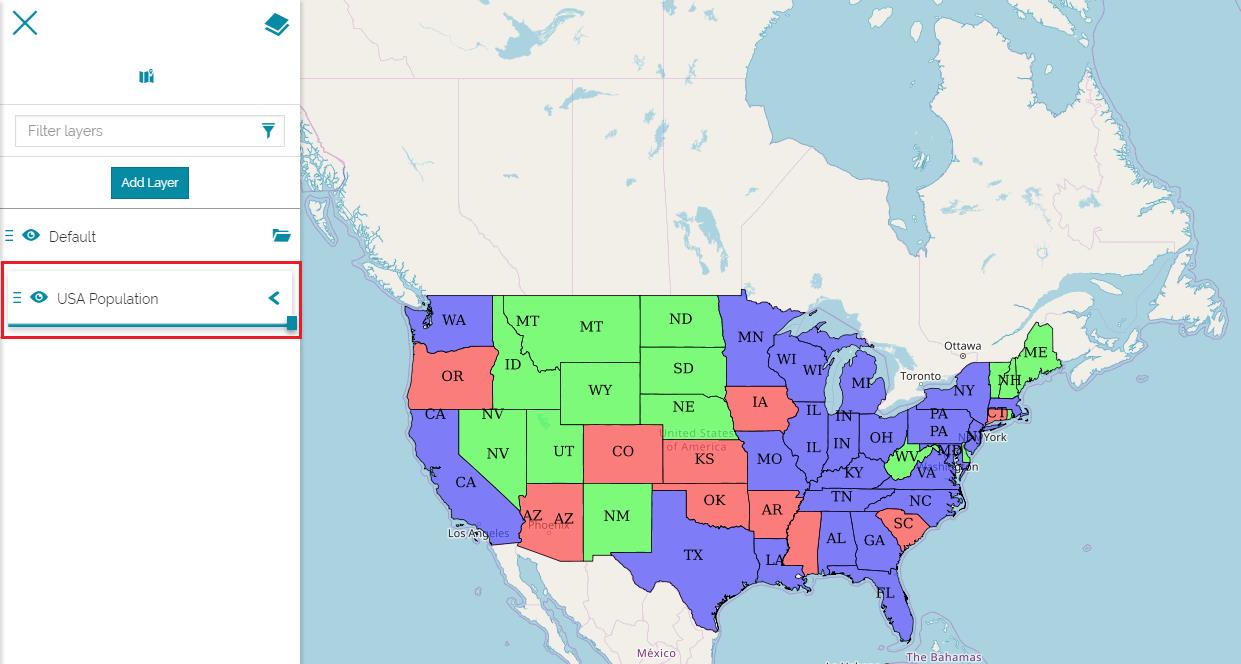
-
You can toggle the layer visibility by switching off
 and on
  the "eye" icon.
 -
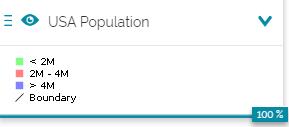
You can expand the layer legend by clicking on the arrow icon
 .
.
-
You can control the layer transparency by scrolling left and right the transparency bar
 .
.
Managing Layer Groups
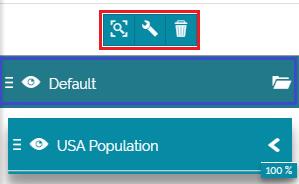
From the TOC, Click on the Default Layer Group. The layer group card will be highlighted and a set of options will be shown.
-
 allows the user to zoom on the existing layers in the group.
 -
 allows the user to manage the properties of the layer group.
 -
 allows the user to delete the layer group and its content.
Click on , you will be addressed to a new page.
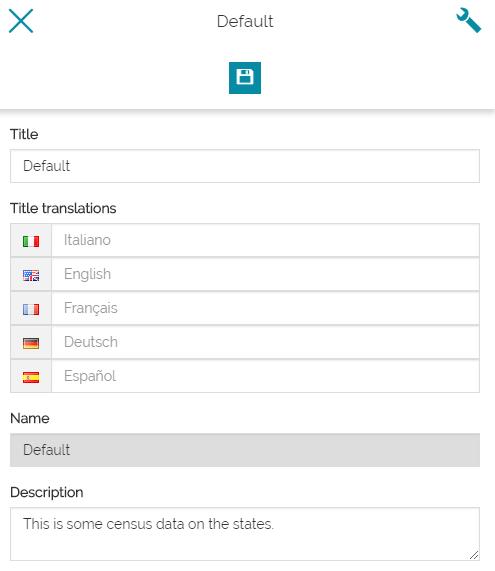
Here you can change the Title of the layer group, its translations in several languages and the description.
-
Change the Title from Default to USA.
-
Then Click on the save icon
 . You will be redirected to the TOC.
Now let us suppose that we want to add new layers and arrange them in new groups:
-
Click on USA layer group to deselect it then Click on
to add another layer to the map.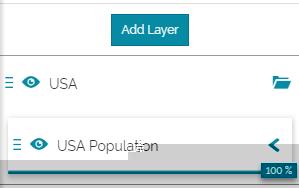
As before, the catalog will open on the right side of the portal.
-
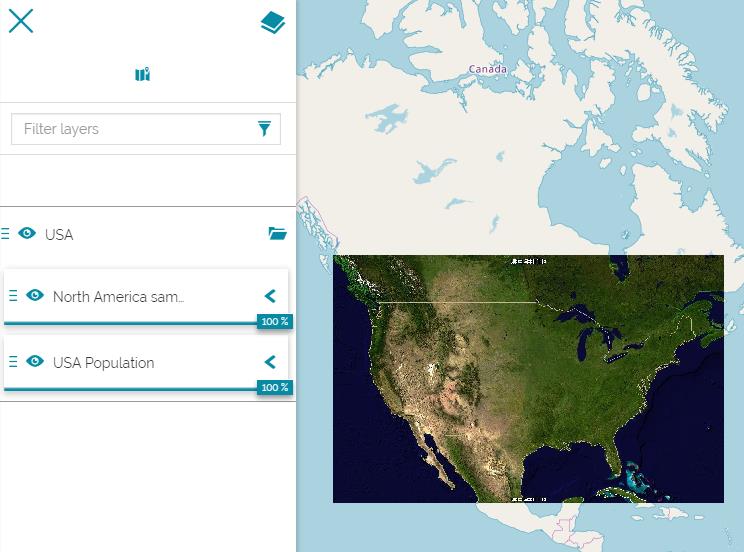
Search the layer North America sample imagery then Add it to the map.
-
The order of the layers in the TOC determines the drawing order in the data frame. Drag and Drop the USA Population layer over the North America sample imagery layer in order to get a right drawing order.
-
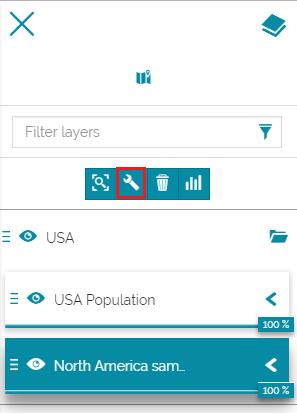
Now, Click on North America sample imagery to select it. A set of options will be shown, it will be addressed in details shortly. For now Click the settings icon of the layer.
-
You will be addressed to a new page. Under the Group field, Enter a new name for the new group, for example: Imagery, then Click on Add Imagery ...
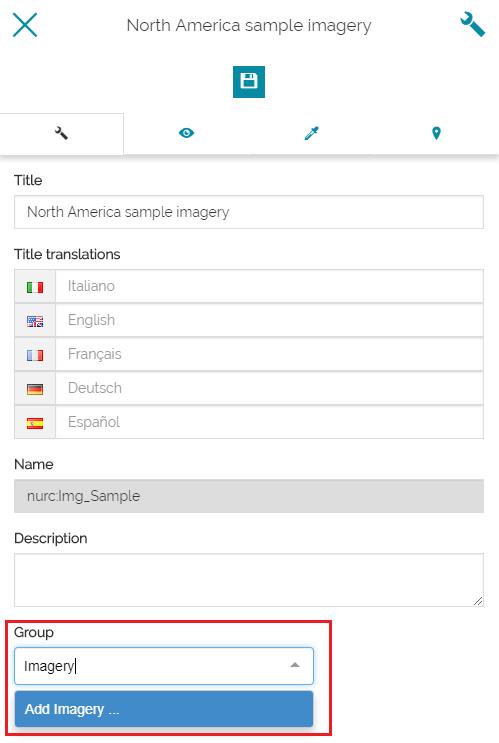
-
Save the edits.
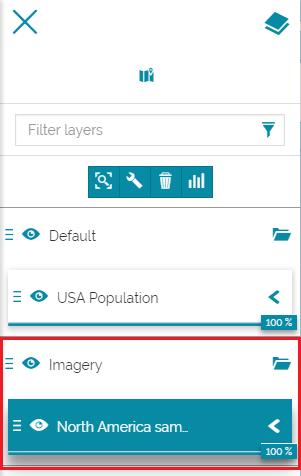
A new group called Imagery will be created containing the layer North America sample imagery.
Managing Layers
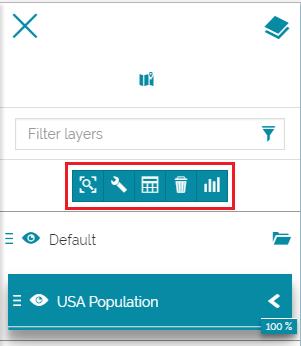
After adding a layer, several options can be accessed from the TOC allowing you to manage the layer and to make analysis on it.
Click on the USA Population layer, added in the previous section, to select it. A set of tools will be ready to be applied on the selected layer.
-
allows you to zoom on the selected layer.
-
allows you to delete the selected layer.
The remaining tools will be faced in detail in separate sections:
- Layer Settings: allows you to manage the layers in groups, to set the display mode and the style of the layers, and to set the format of the feature info.
 Attribute Table: allows you to visualize, query, edit and analyze tabular data related to the layer.
 Widgets: allows you to create charts, texts, tables widgets and add them to the map.