Creating Widgets
In addition to adding layers to the map, in MapStore the user can create widgets from the added layers. Widgets are graphical elements created by the user that describe and visualize qualitatively and quantitatively the data of the layer such as charts, texts, tables and counters.
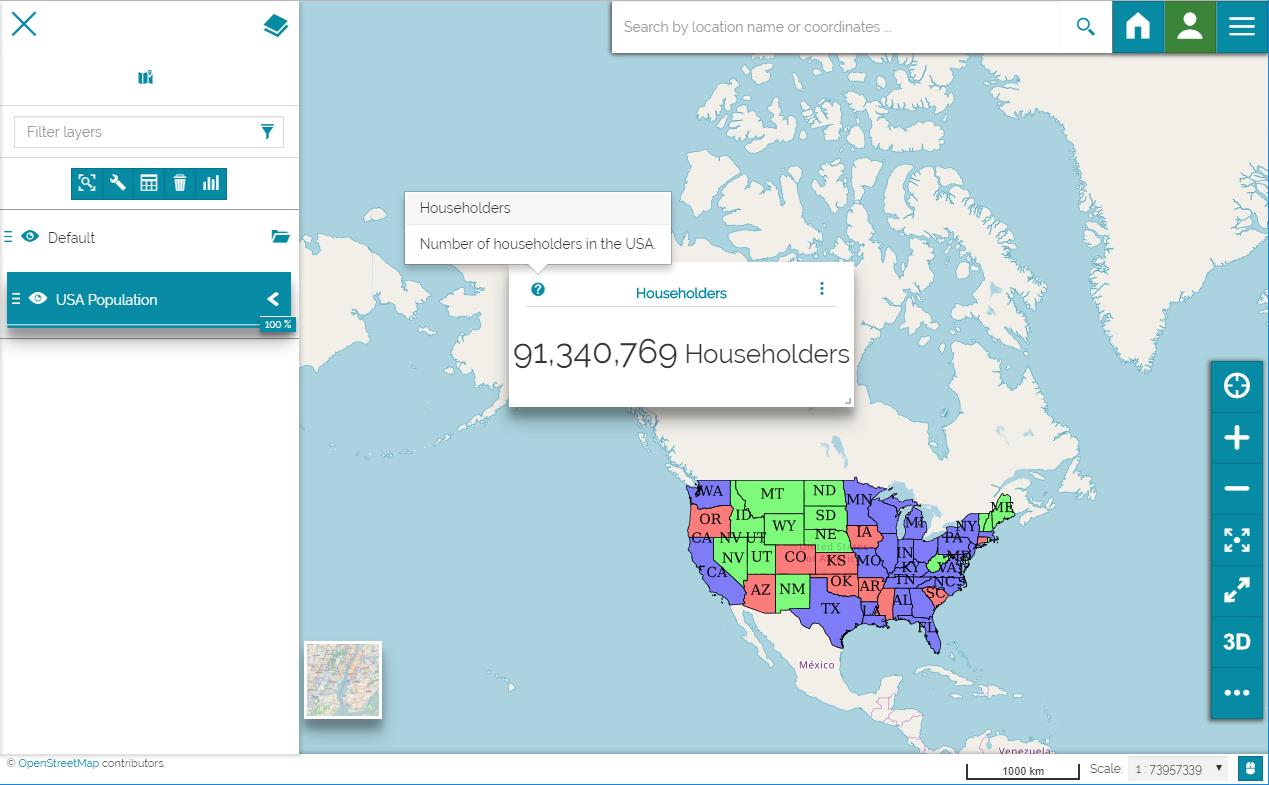
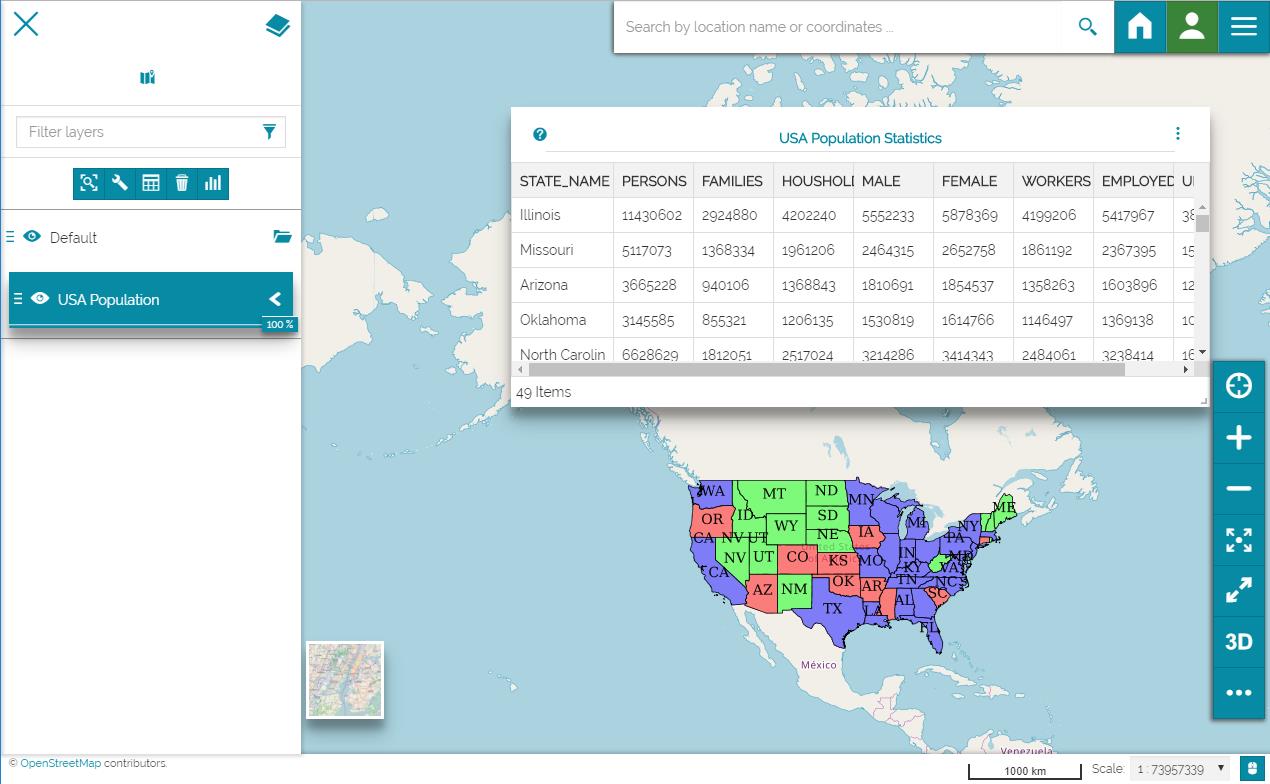
- Open a new map.
- Add a layer (e.g. USA Population).
- Select the layer from the TOC.
- Click on the widget icon
 .
.
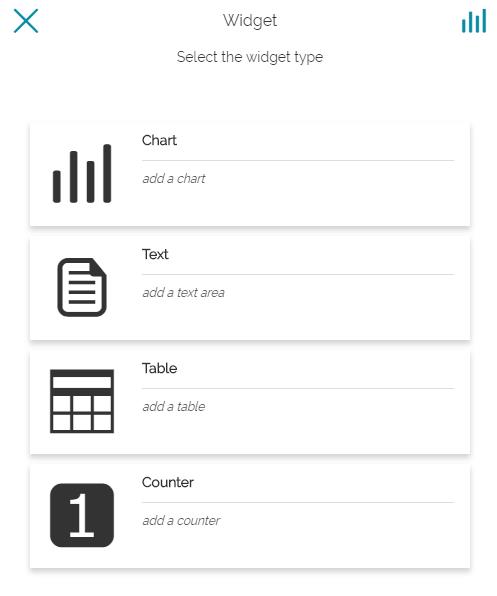
The Widget page will open showing the various widget types to create.
Widgets Tray
When created, The widgets will be placed on the map (or in the dashboard, depending on the context). At both sides of the title of the widget header you can find some tools:
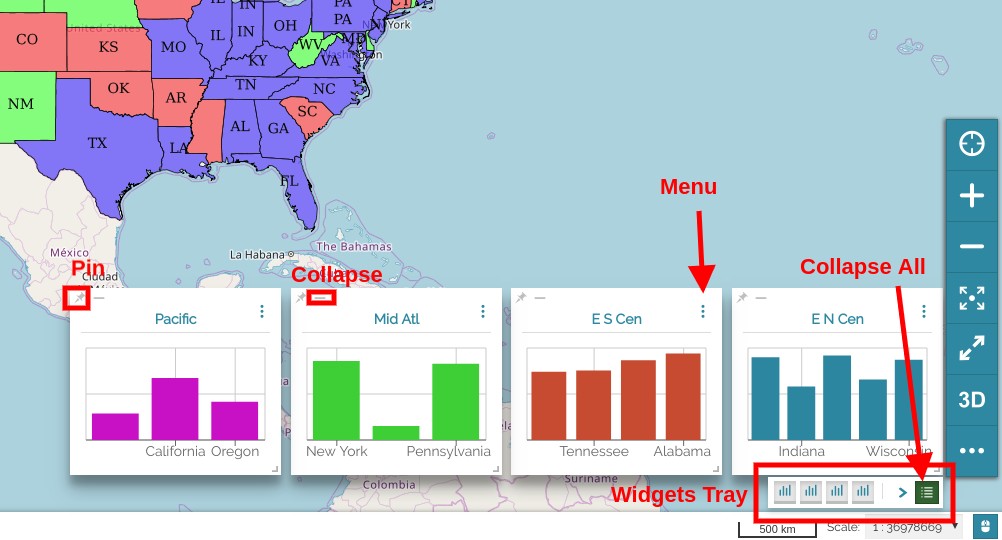
- Pin the pin tool allow to lock the widget position
- Collapse the collapse tool allow to collapse the widgets in the Widgets Tray*
- Menu a set of tools (depending of the widget). Contains the controls to "Remove" or Edit the widget
The Widget Tray is a plugin that allow to expand/collapse widgets one by one. In this tray you can see one item for each widget. You can click on these items to collapse or expand the single widgets. A Collapse All button allow to collapse or expand all widgets at once.
Creating Chart Widget
-
Click on Chart from the list. Another page will open showing the Chart types (Bar Chart, Pie Chart and Line Chart).
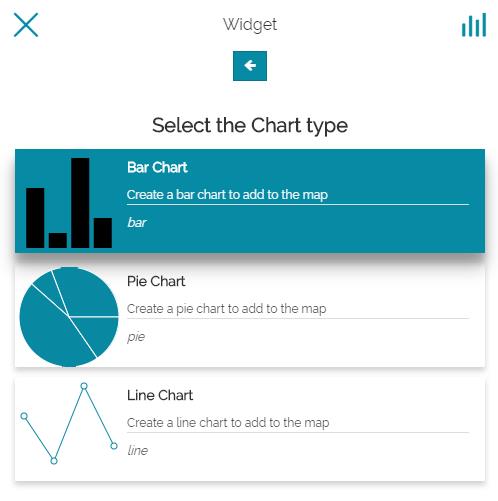
-
Select for example the Bar Chart. You will be addressed to the configuration page to configure the data.
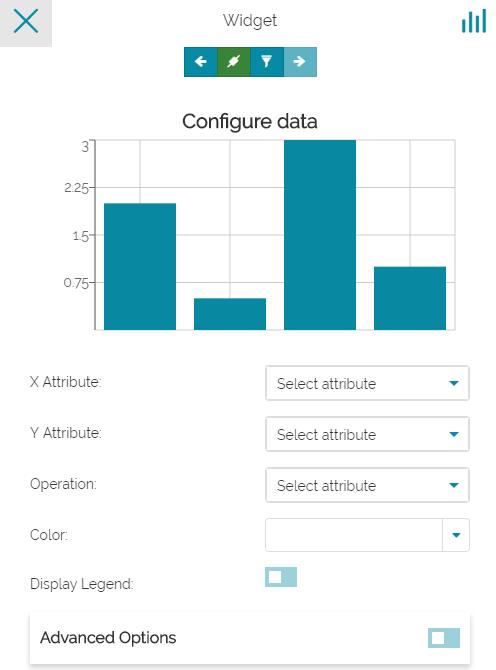
On the top of the page, you can find: a set of options  that allow you to switch back and forward the pages of the form; a connection button (highlighted in green because it is active by default) that connects the chart to the viewport; an advanced filter that allows you to plot only the filtered data.
-
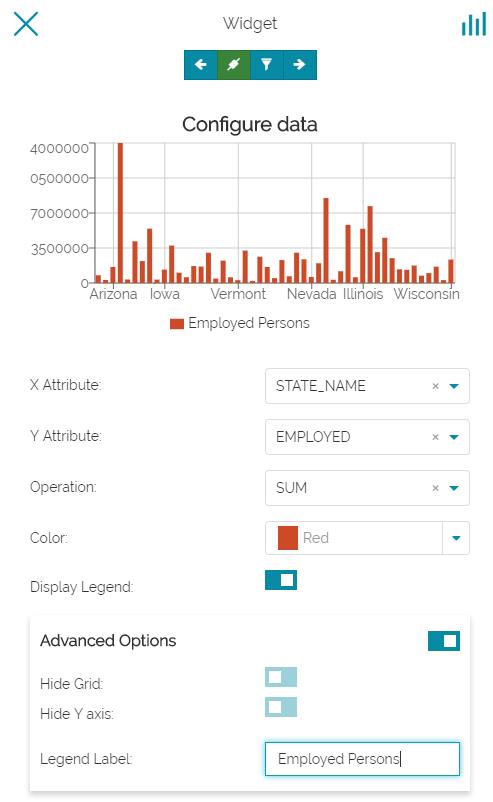
Configure the data you want to plot and the operation. Activating the Advanced Options you can customize the shape of the chart.
-
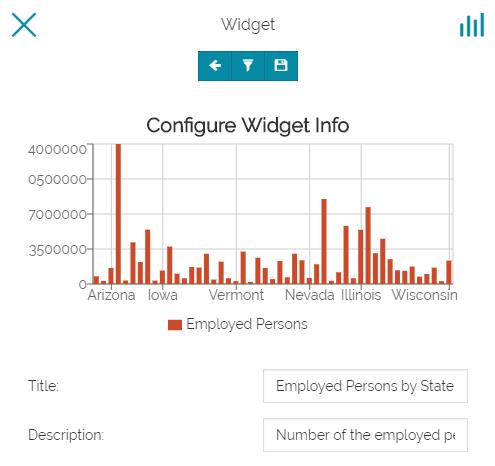
Click on Configure widget options
 .
.- Set a Title and a Description.
- Click on Save.
The widget will be added to the map.
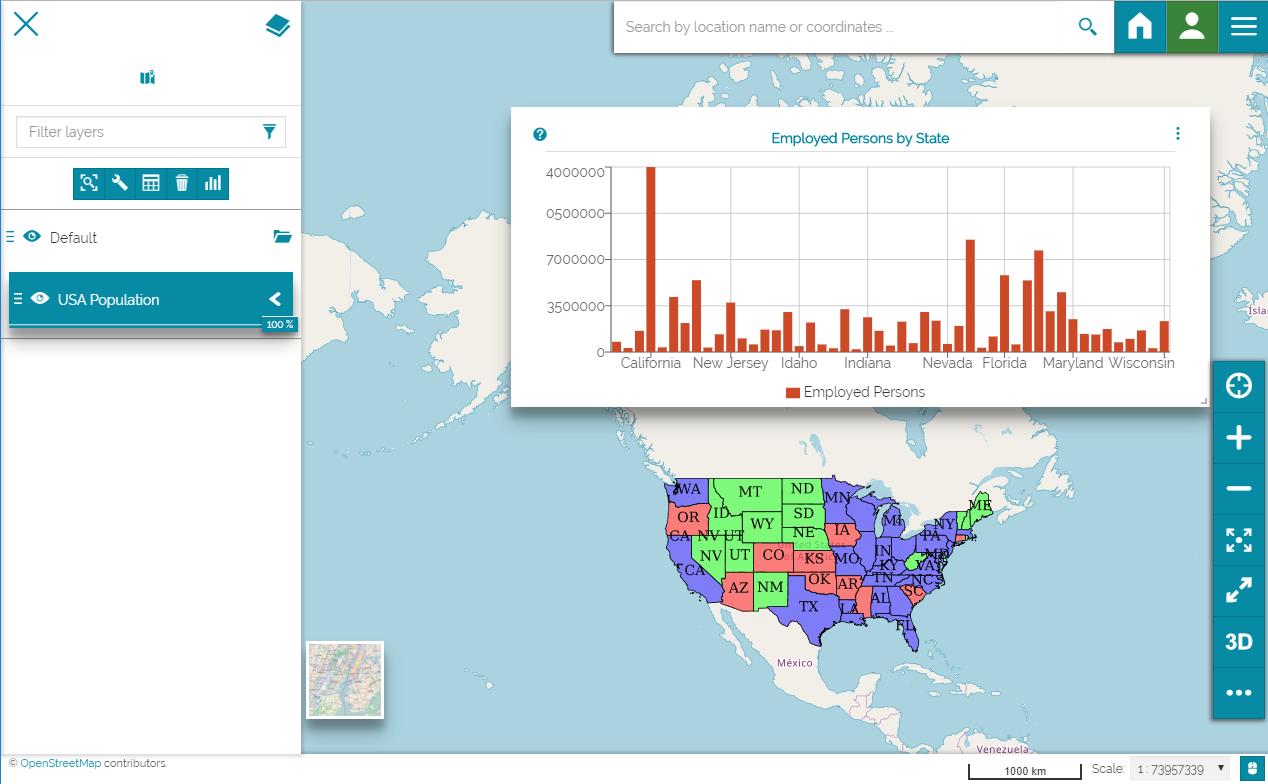
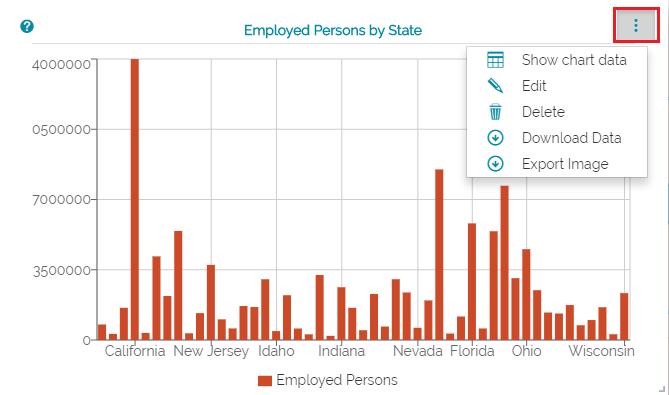
Expanding the options menu of the widget you can show the plotted data, edit the widget or delete it, download the data as a CSV file or save the image of the graph.
Similarly, you can add to the map Pie and Line Charts.
Creating Text Widget
-
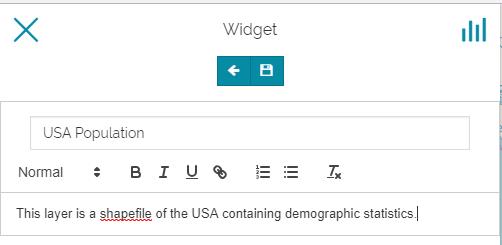
Select the Text widget from the list. The Text widget form will open where you can add a Title and the desired descriptive text.
-
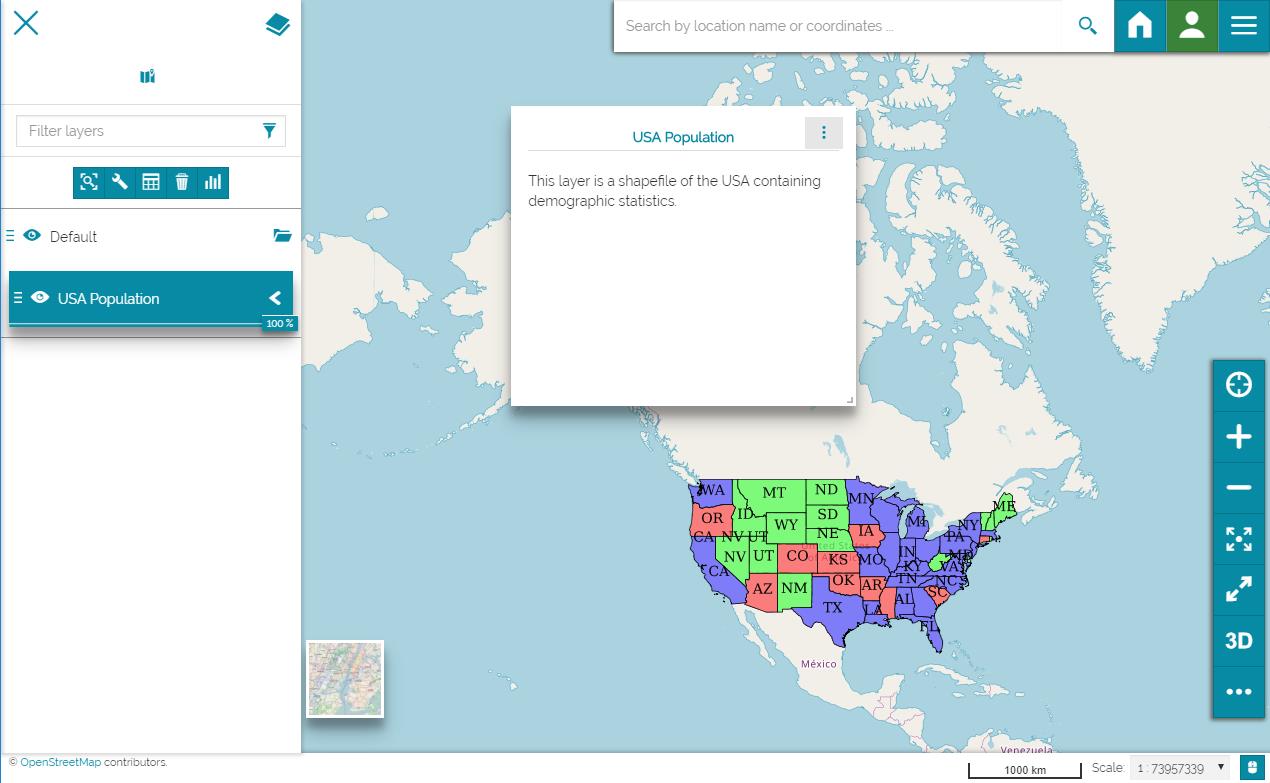
Click on the save button to add the widget to the map.
Creating Table widget
-
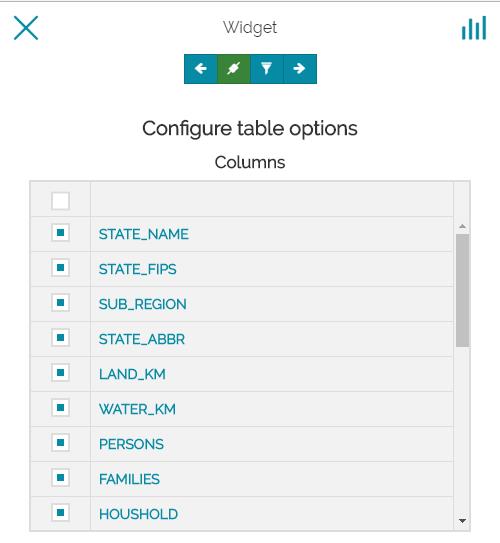
Select the Table widget from the list. You will be addressed to the configuration page.
-
Choose the fields you want to include in the table.
-
click on the next button
. -
Set a Title and a Description.
- Add the widget to the map.
-
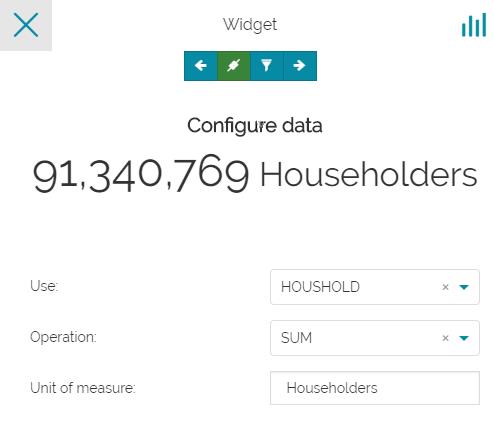
Creating Counter Widget
- Select the Counter widget from the list. You will be addressed to the configuration page.
-
Configure the data you want to count.
-
click on the next button
. -
Set a Title and a Description.
- Add the widget to the map.